European Investment Fund · BMvX
Restructuring a failed digital tool into a platform analysts trust
Context
At the European Investment Fund, portfolio analysts rate and value securitisation transactions originated by external banks.
Problem
The existing Excel-based way of working gave analysts full control, but no digital monitoring, no bank-wide portfolio view, and no speed. An earlier attempt to replace it digitally had already failed, leaving users wary of yet another version.
Role
I led the UX process from research through to validation and structured the workflow from the ground up; the Lead Service Designer acted as sparring partner.
Result
BMvX: a single restructured platform that users accepted in full at delivery and adopted for daily portfolio decisions.
01
Context
The European Investment Fund supports European small and medium sized financing partly by guaranteeing and investing in securitisation transactions: portfolios of loans that banks package and sell on, freeing up capital for further lending. Before a transaction is approved, and throughout its life, EIF’s portfolio analysts model and rate it. They are checking how the underlying loans perform, how cash flows through the deal, and whether the assumptions behind it still hold.
This work spans many transactions from many originating banks, each with its own portfolio’s, tranches and triggers. Analysts had done this work in Excel for years and knew the tool inside out. But Excel could only ever show one transaction at a time, on one analyst’s machine, not the bank-wide, continuously monitored view EIF needed as its portfolio grew.
02
The Challenge
EIF had already tried to move online: a different party had built a replacement, BMv3, in a multi-million euro project. But the result gave analysts far less control than Excel did, and its logic did not match how they actually worked. Adoption stayed low, and analysts came to see it as unusable.
This is where we started: not by designing new screens, but by taking the project apart. We looked at why BMv3 had failed, then went back to how analysts actually worked in Excel, week by week, sitting with them and with the stakeholders who had commissioned the tool, sometimes in the same room. The goal was not a slightly better version of BMv3. It was a system analysts would actually trust with their work.
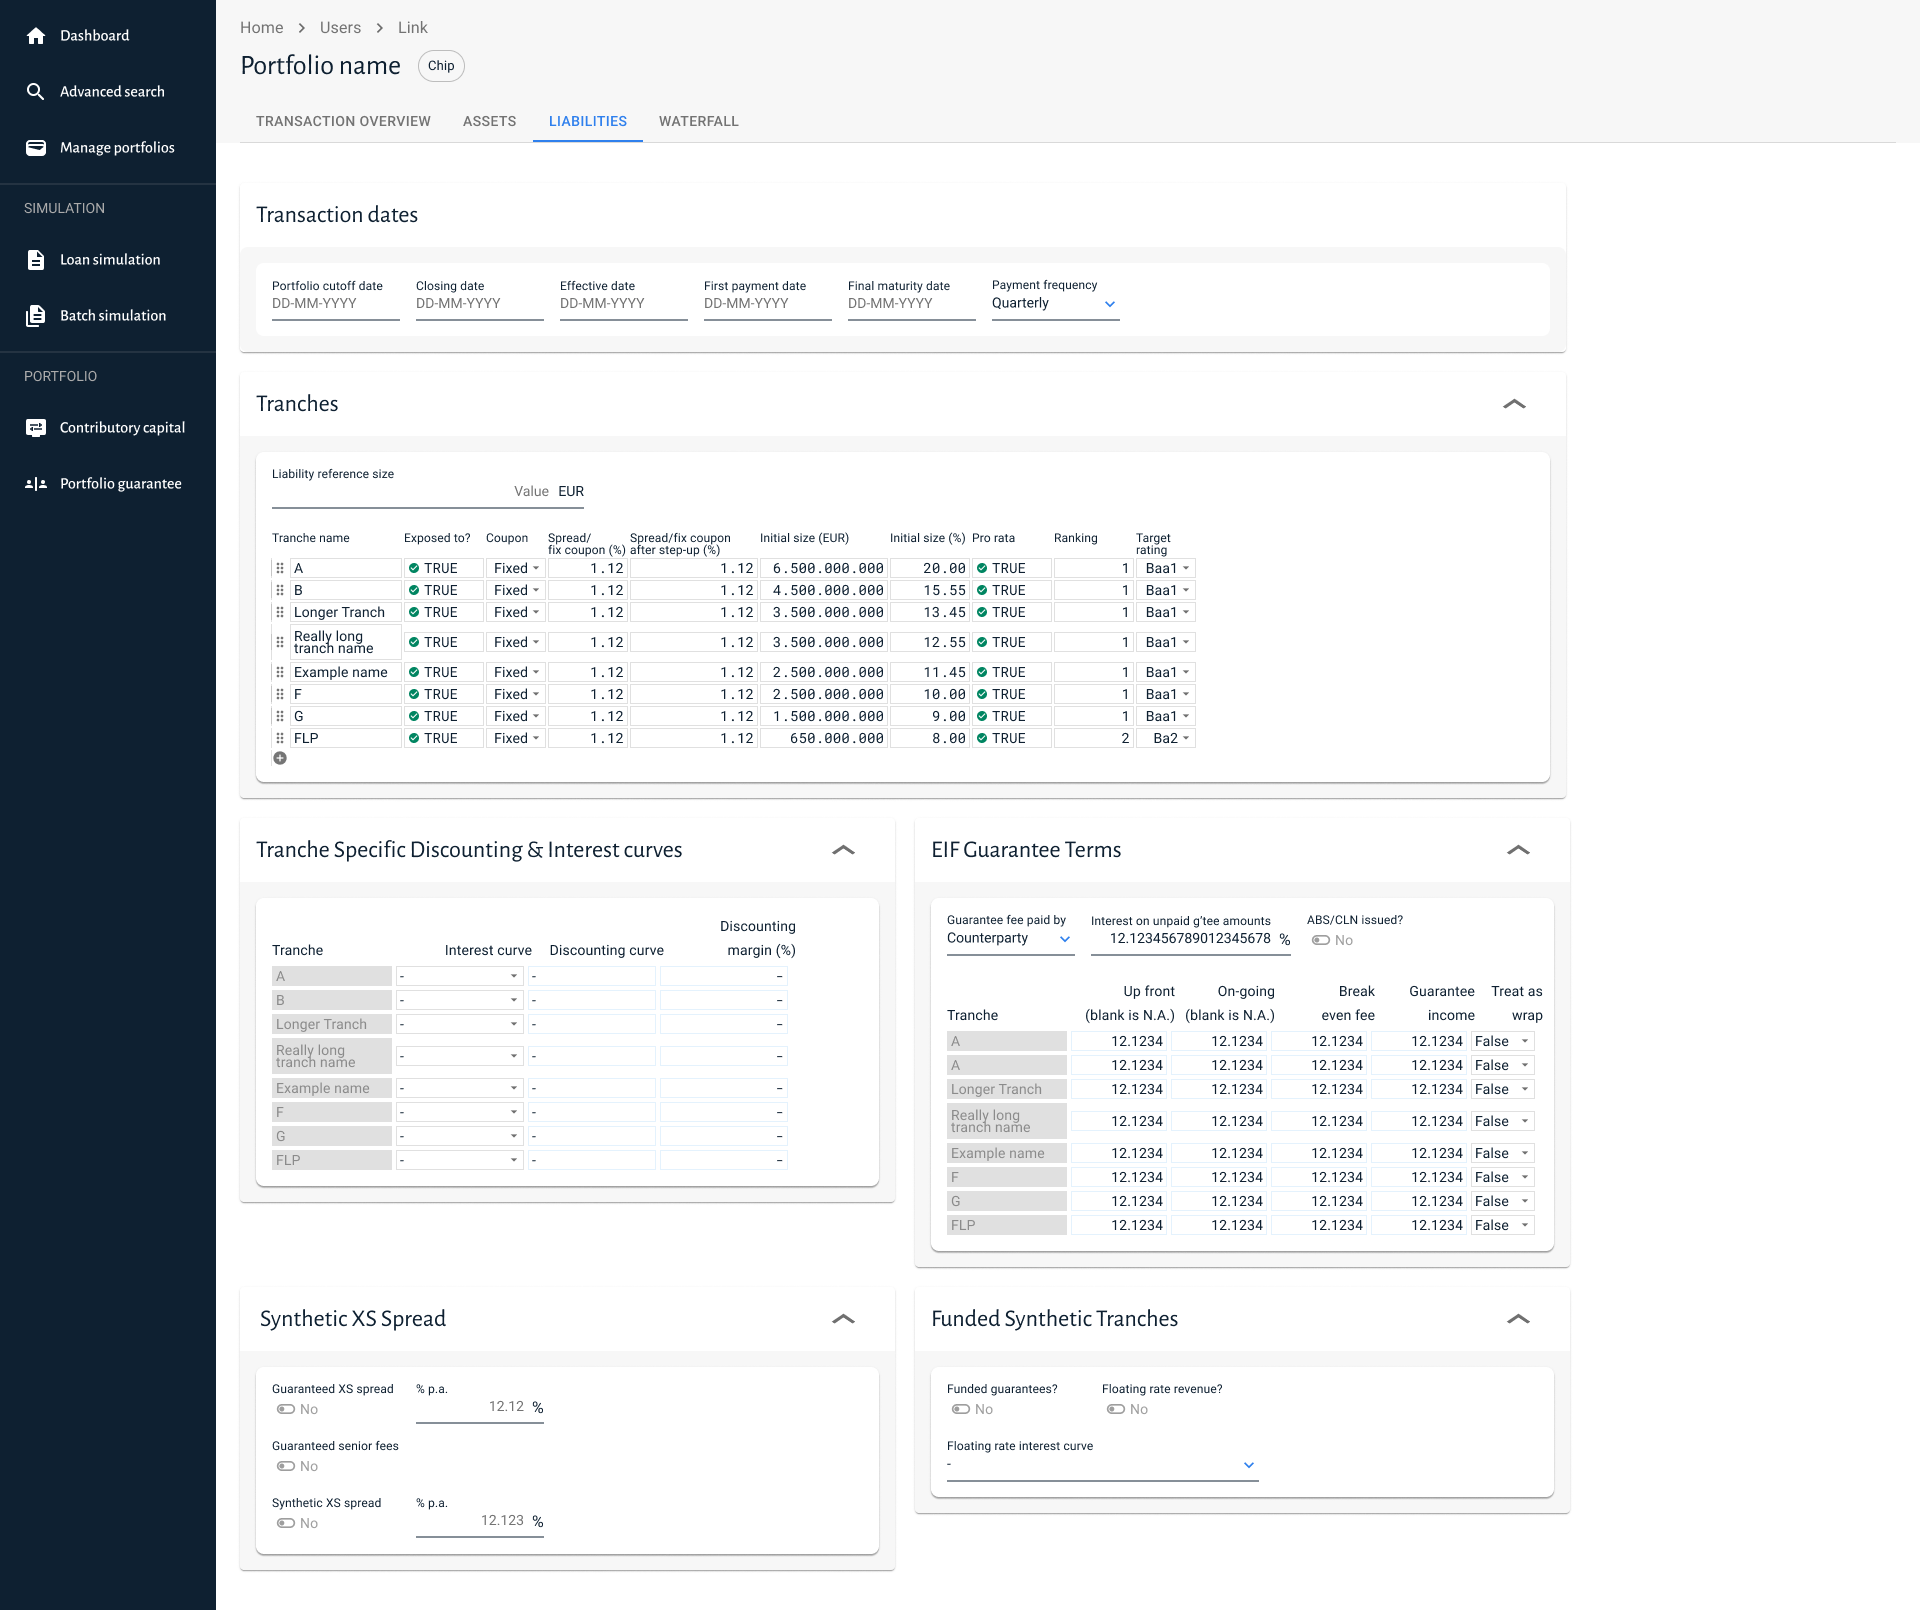
- 01Eighteen modules in one flat, ungrouped list. Nothing indicates which of them a transaction actually needs, or in what order.
- 02Eight further tabs sit inside the single module analysts were told to work in, each with its own set of panels.
- 03Asset side and liability side are separated into different screens, though one transaction spans both.
- Screen boundary
- Content line
- Emphasised line
- Annotation point
Internally, the roadmap simply pointed to the next version: BMv4. We wanted the opposite of what BMv3 had left behind, users expecting yet another version that would not work, so the team named it BMvX instead: a deliberate break from that expectation, not just the next number in a sequence.
03
Research
We started by watching analysts work, not just asking them about it. Sitting with them while they used Excel, and asking questions as we went, was often the only way to understand their workflow and how the old tool actually functioned. Much of that knowledge lived in habits and workarounds nobody had ever written down.
From there, we moved into structured interviews and workshops, keeping three groups involved throughout: the analysts using the tool daily, the stakeholders who had commissioned it, and IT, who had to build and maintain it. User acceptance was the leading criterion, but a decision only stood once stakeholders were satisfied and IT had confirmed it was feasible. We met weekly, sometimes with all three in the same call. BMv3 had failed partly because these groups had been consulted separately. We were not going to repeat that.
Challenges
34 answers
Excel old tool
Tasks to complete
12
Good things
46
Bad things
14
BMv3 new tool
Tasks to complete
8
Good things
12
Bad things
52
Options
24 answers
- Compared group
- Subcategory
- Clustered answer
- Dominant cluster
04
Insights
Underneath the apparent chaos of the Excel file, a structure was already there. Cells were scattered across the sheet and users worked left to right, top to bottom, following highlighted cells by habit. But look closely, and clear steps emerged: information that had to be filled in before anything else could be calculated, and results that forced specific follow-up actions. That structure became the starting point for the new information architecture.
A second insight went against what we expected. We assumed showing fewer functions at once, hiding what wasn’t relevant to a given case, would simply feel like a relief. Instead, the first reaction from analysts was concern: they were worried they were losing control, even though a way to bring hidden functions back had already been built in. Telling them this was not enough. They only trusted it once they had tried it themselves.
After observing closely, clear steps emerged from chaos.
05
UX Principles
From the research, I distilled four principles that guided every decision that followed. Show only what is relevant: at the start of a case, ask for the minimum needed and reveal the rest only when it becomes necessary, instead of presenting every possible function for every possible case type. Never take power away, only postpone it: anything hidden had to be one click away from being shown again, because analysts needed to feel that control, not just be told it existed. Design for fine-tuning, not just entry: most of an analyst’s time went into adjusting and rechecking a case, so that phase needed to be fast and forgiving, not the intake screens. And keep the logic recognisable: analysts trusted the if/then reasoning they already used in Excel, so the new tool had to work with that reasoning, not replace it with something unfamiliar.
06
Structure
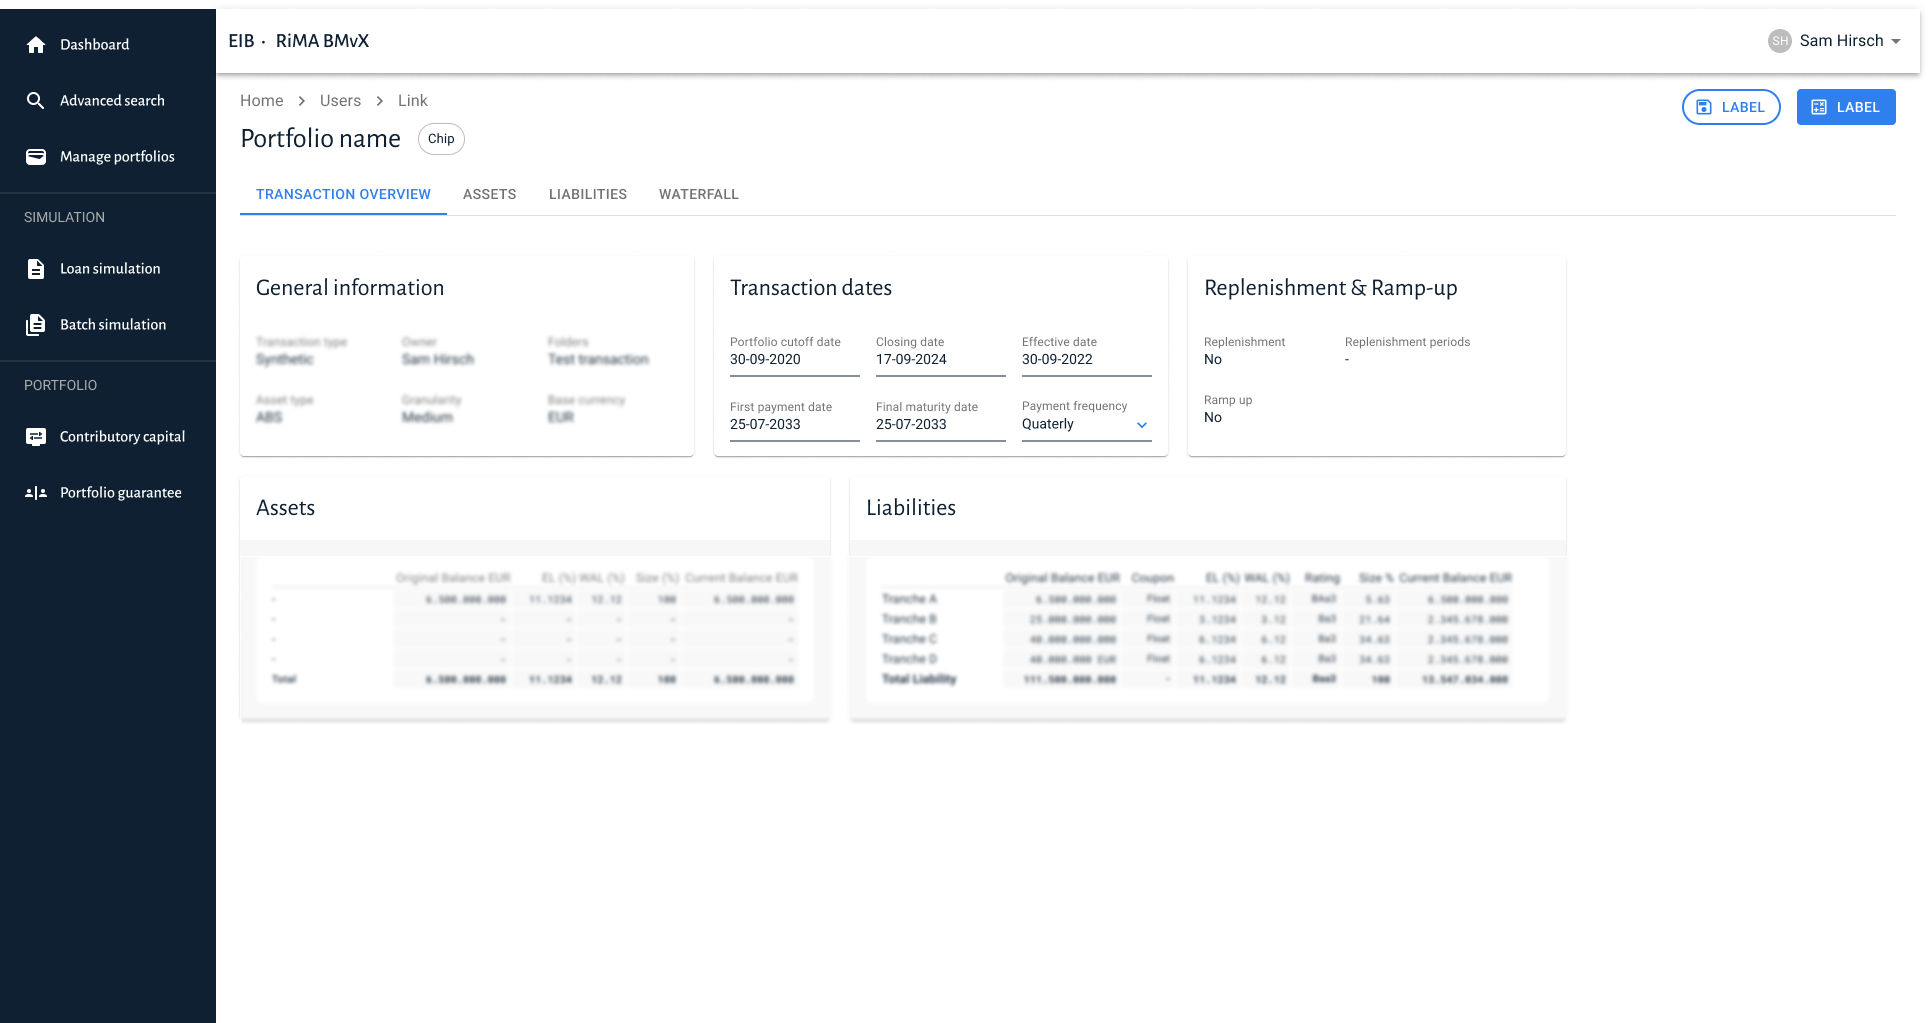
The clearest structural decision I made was splitting the tool into an asset side and a liability side. This was not a cosmetic choice: one side covered the loans themselves, the other covered how the deal around them was structured, and both had to be filled in fully before formulas, triggers and the cash waterfall could be calculated correctly. The split followed a real dependency in the data, not just a convenient way to organise the screen.
Around that split, the overall flow follows two phases. First, a linear intake: portfolio assumptions, then the deal’s structure, then its triggers, each building on the last. Once that is in place, the tool shifts into a loop: run the model, review the cashflow, the cash waterfall and the scenario table, adjust, and run again. Analysts move through that loop as many times as a case requires.
07
Iteration
Inside that review loop, the design deliberately breaks its own linearity. Fine-tuning is where analysts spend most of their time, so that part of the tool had to let them move freely: jump to any part of a case, see immediately what a change affects through highlighted dependencies, and reorder the screen, dragging a specific loan to the top if that is the focus that day.
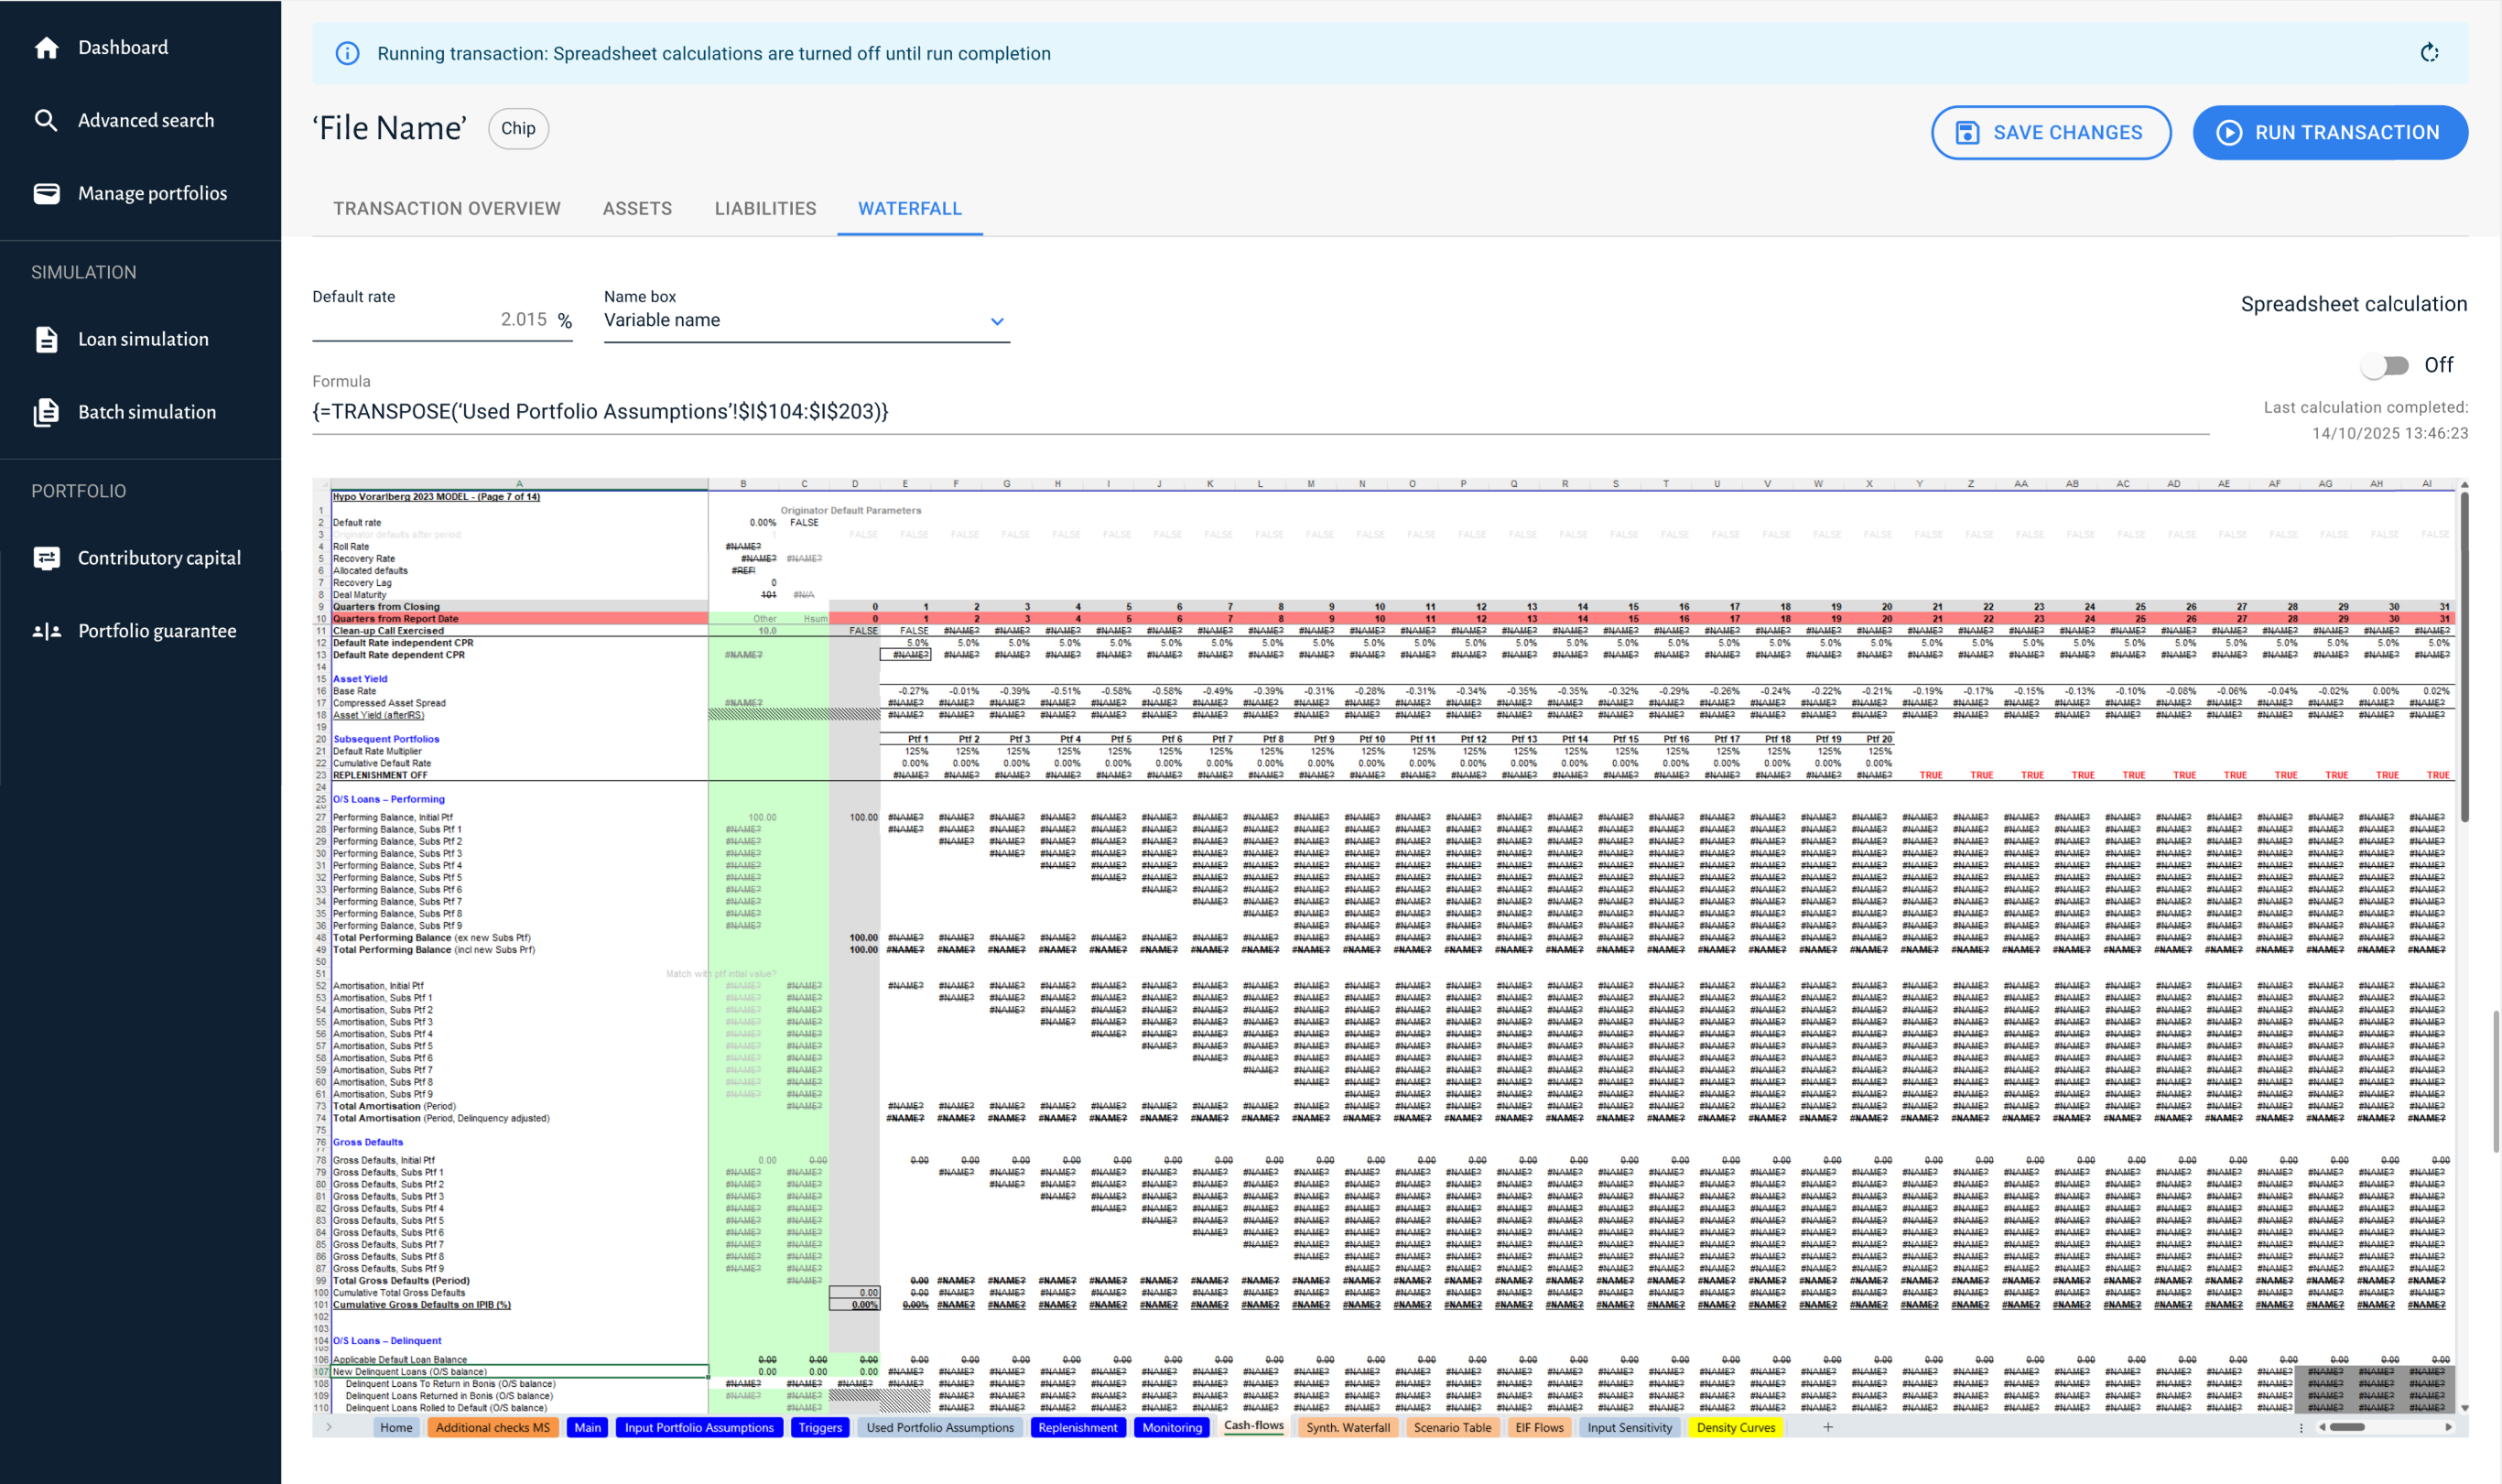
The hardest problem was formulas and triggers, the part of Excel analysts relied on most. I first built an in-app tool for constructing if/then logic into a trigger. It worked, but it was more limited than Excel, and analysts felt that. I dropped it. I had proposed integrating Excel itself from the start; IT initially rejected it as too complex, then reconsidered and helped build it after seeing what the in-app version could not do.
- 01Selected row. Selection is the anchor for every row action.
- 02Dragging a row by its handle. The insertion line shows the new rank.
- 03Bookmarked row, kept findable across a long liability table.
- 04Actions panel. Acts on the selection, so the table itself stays plain.
- Selected
- Dragging
- Drop position
- Active control
08
Validation
I ran five one-on-one usability tests, each built around tasks analysts would actually face: setting up a new case and fine-tuning one that was already running. I deliberately included people who had been less involved in the project so far, to check whether the design held up outside the small group that had shaped it every week.
It did. The sessions surfaced small, specific improvements, not fundamental problems with the structure itself. That was the clearest sign the earlier research and the principles built on it had been the right foundation, not just a good guess.
- 5usability sessions
- 3groups aligned
- 100%acceptance at delivery
09
Result and reflection
At delivery, every analyst and stakeholder who took part in testing accepted the design in full, something neither BMv1, BMv2 nor BMv3 had achieved. Someone with the right information could complete the first steps of a case without being an expert in the system, while the analysts who were experts kept the depth and control they were used to from Excel. The project is now moving toward a live rollout inside EIF.
The clearest lesson was that trust could not be designed on paper alone. I had solved the loss-of-control problem technically early on, with an easy way to bring hidden functions back. But analysts only believed that once they had used it themselves. Explaining a decision, however logical, is not the same as letting someone experience it.
Next case · Frits